[Analysis] Valuation of Startups – Definition | Life Cycle | Valuation Methods
- Blog|Income Tax|
- 7 Min Read
- By Chetan Kulasri
- |
- Last Updated on 28 February, 2024
Latest from Taxmann

Table of Contents
- What’s a Start-up
- What’s typical about startups while valuation?
- Life cycle stage of the company
- Why do most startups fail?
- Developing company life cycle
- Valuation methods across stages of startups
- How early-stage companies get their valuations
- Assigning premiums in valuation
- Venture Capital Method of Valuation
- Other Methods of Valuation
- Valuing using Operating Value Drivers
- Example – Valuing Pre-Revenue Company
- DCF Calculations
- Example – Valuation using transaction multiples
- Case – ZOMATO
1. What’s a Start-up
An entity shall be considered as a Startup:
- Up to 10 years from incorporation
- Private company or Partnership or LLP
- Turnover less than INR 100 crore (in any year)
- Working towards innovation, development or improvement of products or processes or services, or
- A scalable business model with a high potential of employment generation or wealth creation.
Ministry of commerce and industry (Department of Industrial Policy and Promotion)
SEBI has adopted the same definition under AIF regulations
Income Tax Department is using the same definition for tax breaks.
That’s only legal definition for getting tax breaks.
Any company that’s constantly innovating/pivoting is practically a start-up … not just any new company that’s doing something different
2. What’s typical about startups while valuation?
- Stage in life cycle: young and less mature, fewer employees, lower assets, minimal capital.
- Size: Smaller size; higher levels of risk; limited access to capital markets [calls for a small size discount (premium while calculating discount rate) when compared with public companies].
- Overlap in shareholder and management: Shareholders are the management; less agency problem.
- Quality of financial information: Lack of reliable data; lower history; discretionary spends; questionable financial reporting; focus on reducing taxes.
3. Life cycle stage of the company
- Early stage: A company in the earliest stages of development should be valued using the asset-based approach as future cash flows might be too unpredictable and there is no guarantee that the company will be able to operate as a going concern for the foreseeable future.
- Have established product-market fit (PMF): A company that has successfully negotiated the early development stage and is witnessing high growth should be valued using the income approach.
- Matured startups: A stable, relatively mature company should be valued using the market approach or Income approach.
4. Why do most startups fail?
- Lack of Persistence Quitting too early
- Poor corporate governance
- Running out of money or resources
- Underestimating competition
- Too slow on pick up, Late execution, Fear of taking risks
- Not adaptable to market needs
Get a Story and estimate the climax
Every valuation is based on a story. Don’t fall for VFXs
Don’t hide behind management forecasts. You still own the value you report.
5. Developing company life cycle
| Stage 1 | Stage 2 | Stage 3 | Stage 4 | Stage 5 | Stage 6 | |
| Product revenue | None | None | None | Some | growing | Established history |
| Expense History | Limited | Substantive | Substantive | Substantive | Established history | Established history |
| Profitability | Loss | Loss | Loss | Loss | Breakeven/profitable | Established history |
| Management Team | Incomplete | Expanding | Complete | Complete | Complete | Complete |
|
Product Development |
Limited | Underway | Beta Testing | Order fulfilment | Order fulfilment | Ongoing |
| Financing Sources | Angels/Early VC | VC | VC/Strategic | Mez fin/strategics | Strategic/IPO |
Self Funding/ Debt + Equity |
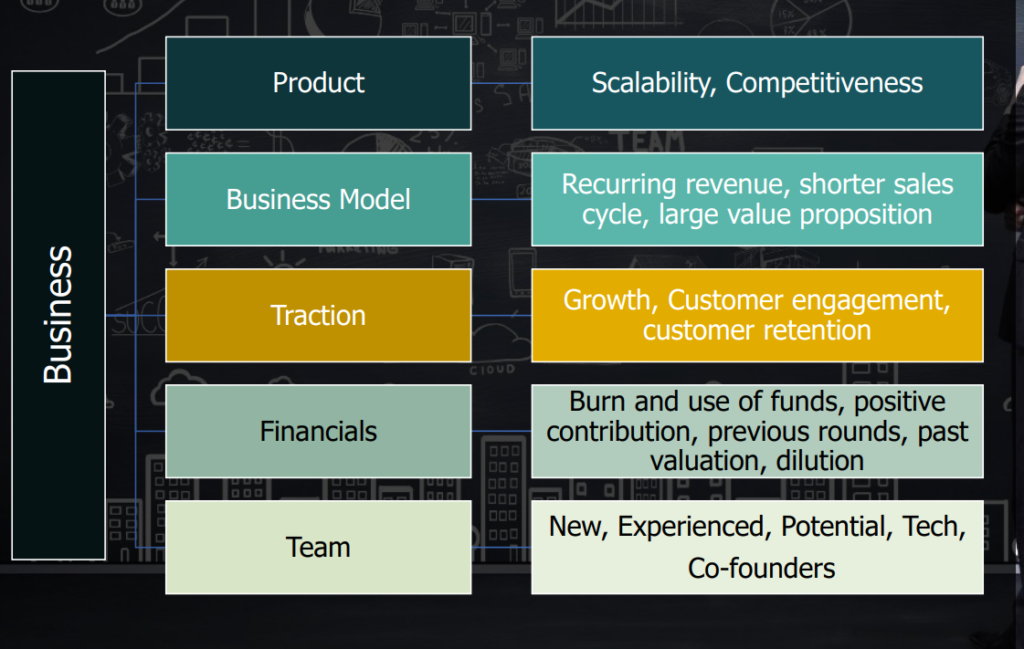
6. Valuation methods across stages of startups
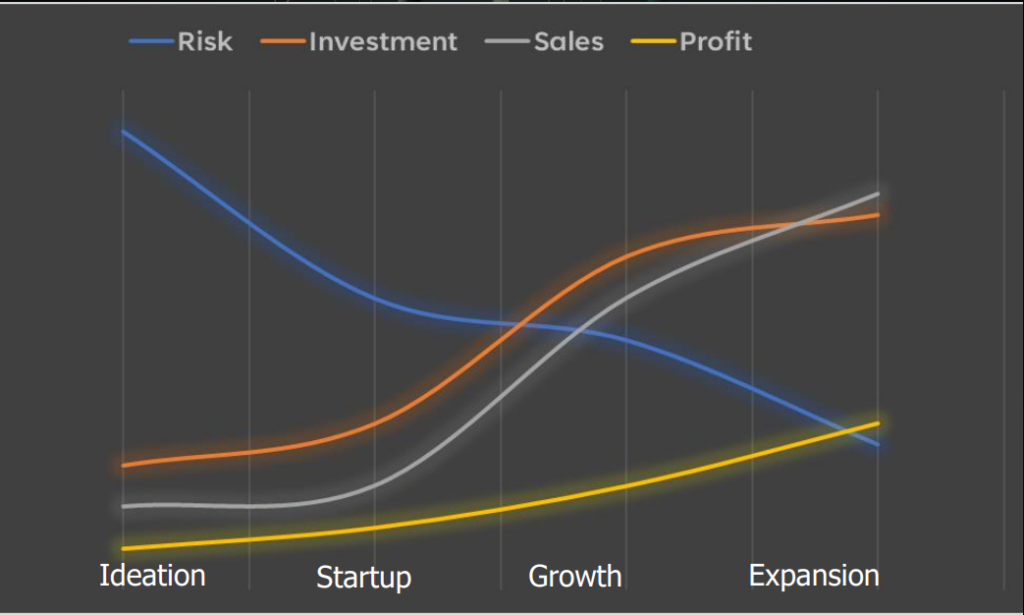
Focus on
7. How early-stage companies get their valuations
Story: Most investors bet on the founders and their business story. No one knows the future and thus, valuation is often difficult and always wrong.
Negotiation: During early stages, funds are raised based on negotiation [the early-stage version of demand and supply] and thus, startups are “priced” not “valued”.
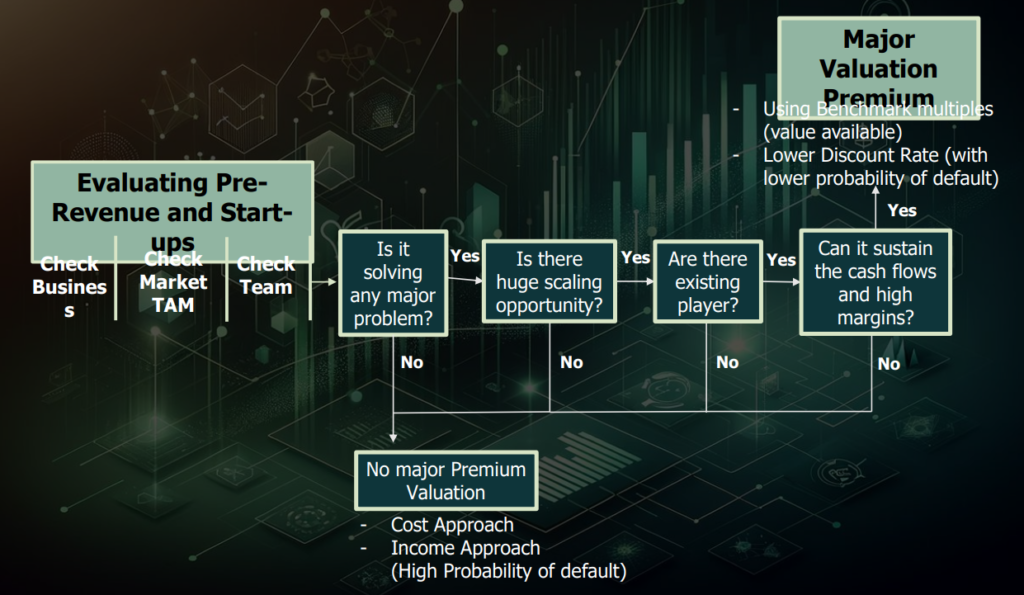
8. Assigning premiums in valuation
9. Venture Capital Method of Valuation
Step 1: Estimate the expected earnings or revenues in a future year.
Step 2: Multiply the earnings in the future year by the multiples of earnings.
𝐸𝑞𝑢𝑖𝑡𝑦 𝑉𝑎𝑙𝑢𝑒 𝑎𝑡 𝑡ℎ𝑒 𝑒𝑛𝑑 𝑜𝑓 𝑓𝑜𝑟𝑒𝑐𝑎𝑠𝑡 ℎ𝑜𝑟𝑖𝑧𝑜𝑛
= 𝐸𝑥𝑝𝑒𝑐𝑡𝑒𝑑 𝐸𝑎𝑟𝑛𝑖𝑛𝑔𝑠𝑦𝑒𝑎𝑟 𝑛 ∗ 𝐹𝑜𝑟𝑒𝑐𝑎𝑠𝑡𝑒𝑑 𝑃𝐸
Step 3: The estimated value is discounted back at the target rate of return.
𝐸𝑞𝑢𝑖𝑡𝑦 𝑉𝑎𝑙𝑢𝑒 𝑡𝑜𝑑𝑎𝑦 = 𝐸𝑞𝑢𝑖𝑡𝑦 𝑣𝑎𝑙𝑢𝑒 𝑎𝑡 𝑡ℎ𝑒 𝑒𝑛𝑑 𝑜𝑓 𝑓𝑜𝑟𝑒𝑐𝑎𝑠𝑡 ℎ𝑜𝑟𝑖𝑧𝑜𝑛 (𝑛) / 1 + 𝑇𝑎𝑟𝑔𝑒𝑡 𝑟𝑎𝑡𝑒 𝑜𝑓 𝑟𝑒𝑡𝑢𝑟𝑛
9.1 Valuation methods
Market Approach
- Multiples
- Industry valuation benchmarks – useful as a sanity check of values
- Available market prices
Income Approach
- Discounted Cash Flow Method
Replacement Cost Approach
- Net Assets
9.2 VC Return Expectations
The rates of return expected by Venture Capitalists for companies in different stages of financing as described in the two publications identified in the American Institute of Certified Public Accountants (AICPA).
| Stage of Development | Plummer | Scherlis and Sahlman |
| Start Up | 50% – 70% | 50% – 70% |
| First Stage or ‘Early Development | 40% – 60% | 40% – 60% |
| Second Stage or ‘Expansion | 35% – 50% | 30% – 50% |
| Bridge/IPO | 25% – 35% | 20% – 35% |
- Plummer, James, QED Report on Venture Capital Financial Analysis
- Scherlis, Daniel R. and William Sahlman, “A Method for Valuing High, Risk, Long Term, Investments: The Venture Capital Method,” Harvard Business School
Example:
A young EdTech company Om Ltd is expected to go public in 10 years from now. The valuer expects that the net profits of the company 10 years from now will be INR 95 crores.
Average PE Multiple of publicly traded EdTech companies is 20. Om Ltd is evaluating fund raising from investors. Investors are expecting 45 percent from the investment until the company goes public.
Solution:
Exit Value = 95 x 20 = INR 1900 Crore
Value of the company today = 1900/1.45^10 = INR 46.25 Cr
10. Other Methods of Valuation
10.1 Berkus Method
| Key success factors | Add to company value up to: |
| Sound Idea (basic value) | USD ½ million |
| Prototype (reducing technology risk) | USD ½ million |
| Quality Management team (reducing execution risk) | USD ½ million |
| Strategic Relationships (reducing market risk) | USD ½ million |
| Product Rollout | USD ½ million |
10.2 First Chicago Method
- Projecting future cash flows:
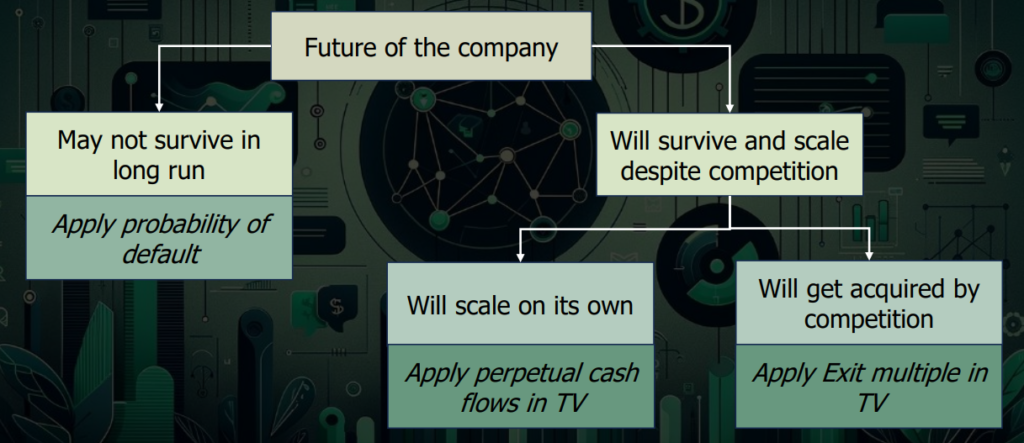
- Projecting Terminal Value:
- Discounting back future cash flows and terminal value:
- Calculating present value of the firm:
11. Valuing using Operating Value Drivers
Valuing Flipkart
Amazon = Market Capitalisation
Number of Users on Amazon.
Value Driver: Value per user (ValuePU) = Market Cap / No. of users.
Flipkart Value = Number of users (given by Flipkart) x ValuePU
Adjustment for:
- Marketability [Listed vs Unlisted]
- Country specific growth factors – US Growth vs India growth
- Global presence
- Product diversification
- Currency differences
Alternatively, Ecommerce companies were valued based GMV Multiple.
12. Example – Valuing Pre-Revenue Company
Year 2014, Valuation of a Text Messaging App ChatApp with 1.6 million users. The company does not report any revenues.
| Value as per Comparable Transactions Method | Amount |
| Enterprise Value of WhatsApp (USD) as part of acquisition | 19,000,000,000 |
| Value of acquired users | 2,026,000,000 |
| Daily Active Users of WhatsApp | 450,000,000 |
| Value per Daily Active User (USD) | 4.50 |
| Exchange Rate | 70.00 |
| Value per Daily Active User (INR) | 338 |
| Less: Adjustment for Size (50%) | 169 |
| Adjusted value per Daily Active User (A) | 169 |
| Daily Active Users of CHATAPP (B) | 16,00,000 |
| Value of CHATAPP (A) x (B) | 27.04 Cr |
13. DCF Calculations
| OmCom Pvt Ltd | |
| Growth rate for next 5 years | 18.00% |
| Terminal Growth Rate | 6.00% |
| Cost of Equity | 16.50% |
| Additional Risk premium | 4.50% |
| WACC/Discount Rate | 21.00% Since no Debt. Thus Cost of Equity is same as WACC |
| FCFF (Amount in INR ‘000) | 0 2019 A |
1 2020 E |
2 2021 E |
3 2022 E |
4 2023 E |
5 2024 E |
5 (Terminal) 2024 E |
| Revenue | 353,066.94 | To be estimated for each year | |||||
| PAT | 32,280.48 | To be estimated for each year | |||||
| Add: Depreciation and Non-Cash Expenses | 14,922.11 | To be estimated for each year | |||||
| Less: Capital Expenditure | 15,810.47 | To be estimated for each year | |||||
| Less: Changes in Non-Cash Working Capital | (12,723.52) | To be estimated for each year | |||||
| Add: Interest (1 – tax rate) | – | To be estimated for each year | |||||
| Free Cash Flow to the Firm (FCFF) | 44,115.64 | 49,850.67 | 56,331.26 | 63,654.32 | 71,929.39 | 81,280.21 | |
| Terminal Cash Flows | 574,380.13 | ||||||
| PV of Cash Flows | 41,198.90 | 38,475.01 | 35,931.21 | 33,555.59 | 31,337.04 | 221,448.40 | |
| Value of the Firm | 401,946.15 | ||||||
| Less: Value of Debt | 0.00 | ||||||
| Add: Cash | 48,90.56 | ||||||
| Value of Equity (Operating Assets) | 406,836.72 | ||||||
| Less: Discount for KMP | 14,200.00 | The director will resign after takeover; value attributed to such director | |||||
| Add: Investment Property | 54,000.00 | ||||||
| Value of Equity | 446,636.72 | ||||||
| No. of Shares (‘000) | 1,319.69 | ||||||
| Value per Share (INR) | 338.44 | ||||||
14. Example – Valuation using transaction multiples
| Transaction date | Target Co. | EV (INR Cr) | Revenue (INR Cr) | EV/Revenue |
| Jun-23 | A Ltd | 225.0 | 25.5 | 8.8x |
| Feb-22 | B Ltd | 182.5 | 23.5 | 7.8x |
| Jul-23 | C Ltd | 65.5 | 9.1 | 7.2x |
| Apr-22 | D Ltd | 125.0 | 12.0 | 10.4x |
| Average | 8.6x | |||
| Add: Size factor | 10% | |||
| Add: Brand factor | -5% | |||
| Add: higher growth factor | 5% | |||
| Adjustment | 10% | 0.9 | ||
| Concluded EV/Revenue Multiple | 9.4x | |||
| Revenue (INR Cr) | 15.5 | |||
| Enterprise Value (INR Cr) | 145.79 |
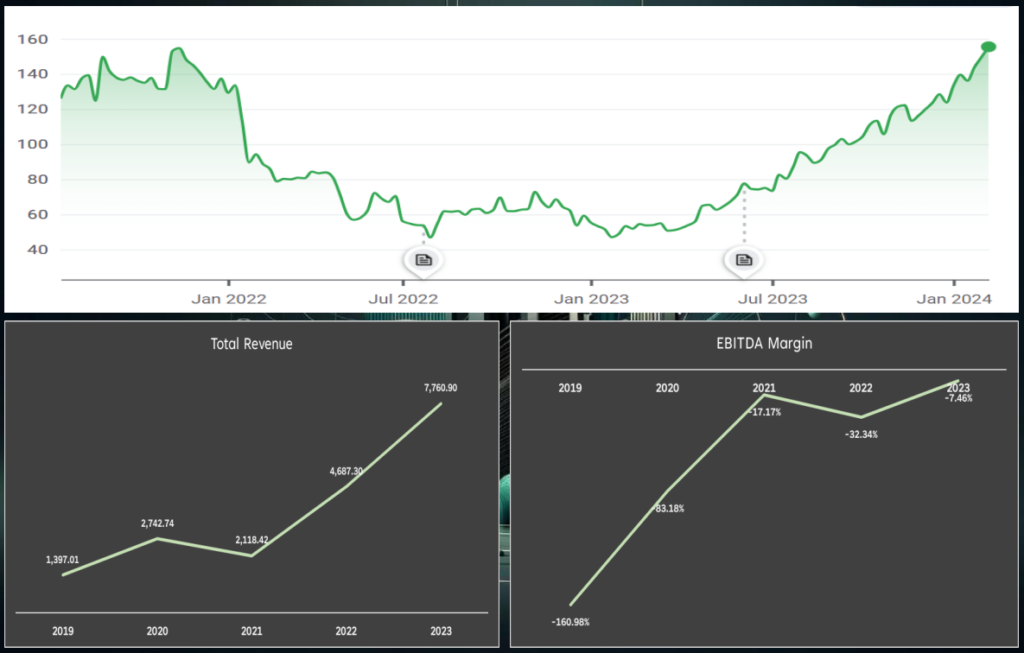
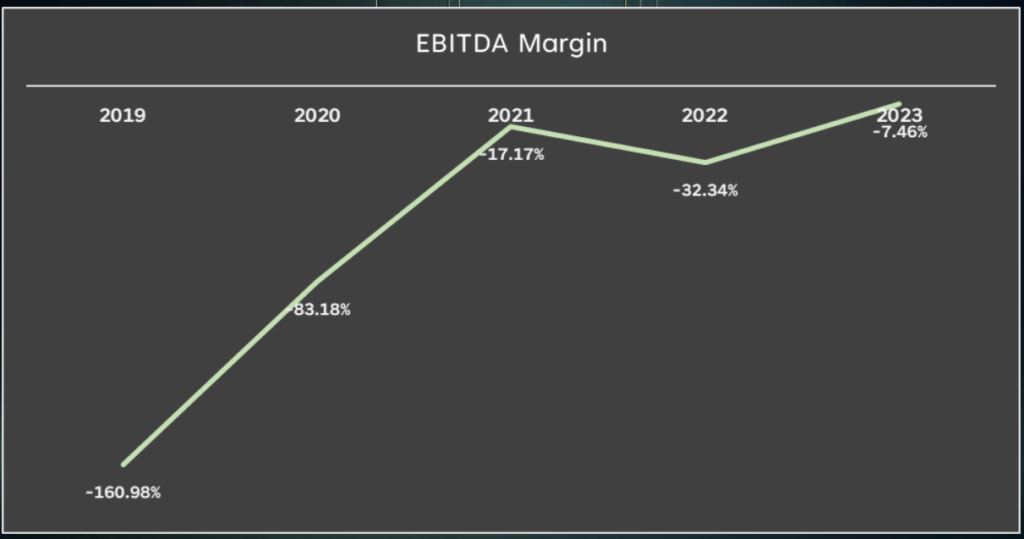
15. Case – ZOMATO
| Key Business and Revenue Model | Revenue Drivers and Cost drivers |
| Food Delivery (Transaction-based advertising) |
No. of Monthly transacting users Order frequency Commission Rates restaurant partners Delivery Ads from Restaurant partners Key Costs: Delivery Cost, Discounts and marketing spends |
| Dining (Advertising) | No. of Monthly Average Users Delivery Ads from Restaurant partners Key Costs: Sales team |
| Hyperpure (Transaction based) | No. of Restaurant partners Order Frequency Value of supplies per order Key Costs: Cost of goods sold |
| Zomato pro (Subscription) | Membership Fees No. of pro members Key Costs: Marketing |
| Key performance indicators | |
| No. of food delivery Restaurants | Up from 148K in 2021 to 210K in 2023. |
| Average Monthly users | Up from 6.8 mn in 2021 to 17 mn in 2023 |
Disclaimer: The content/information published on the website is only for general information of the user and shall not be construed as legal advice. While the Taxmann has exercised reasonable efforts to ensure the veracity of information/content published, Taxmann shall be under no liability in any manner whatsoever for incorrect information, if any.

