Decision Making with Excel – What If Analysis
- Other Laws|Blog|
- 7 Min Read
- By Taxmann
- |
- Last Updated on 1 March, 2023
Latest from Taxmann

Table of Contents:
1.1 Goal Seek
1.2 Data Tables
1.3 Scenario Manager

Also, Check out Taxmann's Basics of Computer Applications in Business. It is a comprehensive & authentic textbook written to impart computer skills and knowledge to commerce students & enhance their understanding of information technology tools in handling business operations. The book's focus is on the application part while providing basic information about computers for first-time readers.
1. What-If Analysis
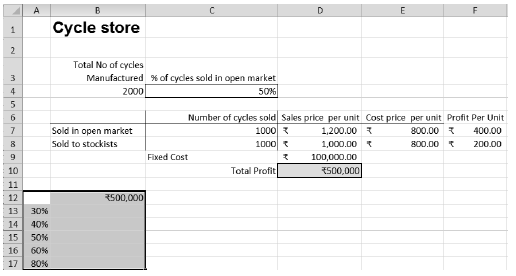
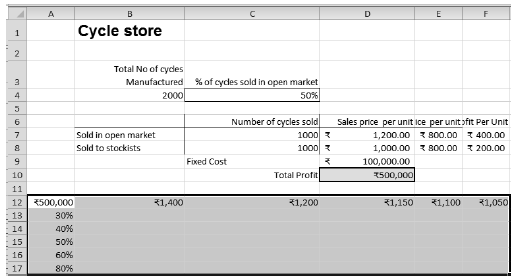
Imagine that you are a cycle manufacturer who manufactures 2000 cycles per annum at a unit cost of ` 800. You have two options to sell them, selling to approved stockists at a unit price of `1100 or selling in open market for a unit price of `1200. There is a fixed cost of production `100000. Currently you sell 40% of your production in the open market.
As a businessman you may think of various situations that you may encounter in future because of changes in any of the variables that affect your profits. Some of them may be:
(1) What percentage of units produced you should sell in open market in order to achieve a target profit?
(2) If sales price per unit in open market assumes a number of hypothesized prices how will it affect your total profit?
(3) If we vary both sales price per unit in open market and the proportion sold in open market how will it affect your total profit?
(4) What will happen to profits if more than two variables change?
To answer such problems we may use What-if-analysis tool of excel.
The use of What-If Analysis tools in Excel allows you changing the values in cells to see how those changes will affect the outcome of formulas on the worksheet.
There are three kinds of What-If Analysis tools:
(1) Goal Seek,
(2) Data Tables, and
(3) Scenario Manager
1.1 Goal Seek
If you know your target and you want to find out what should be the value of an input to achieve the desired result, you may use goal seek.
For the current business situation, the profit earned is `460000. If you wish to know what percentage of units produced should be sold in open market in order to make a profit of `500000, you may use goal seek.
You need to remember that goal seek can suggest changes in one variable only.
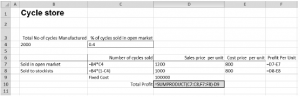
The alternative formula to determine the total profit could be =C7*F7+C8*F8-D9
To determine the proportion required to be sold in open market to achieve the profit of `500000, follow the following steps:
-
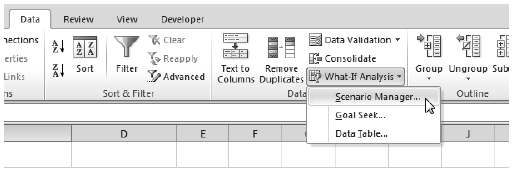
- On the Data tab, click What-If Analysis and then click Goal Seek.
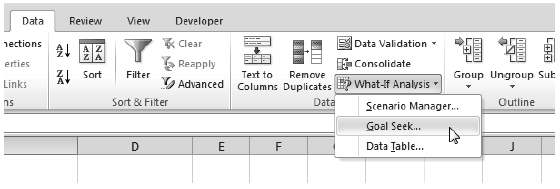
- On the Data tab, click What-If Analysis and then click Goal Seek.
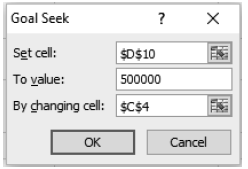
The Goal Seek dialog box appears.
-
- Select cell D10, the cell with the output formula in ‘set cell’ box.
- Click in the ‘To value’ box and type the desired output `500000.
- Click in the ‘By changing cell’ box and select cell C4, the cell with the variable that you want to change.
- Click OK.
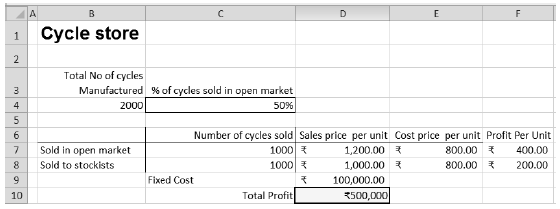
Excel suggests that if you 50% of your cycles produced to open market you will earn a profit of `500000.
1.2 Data Tables
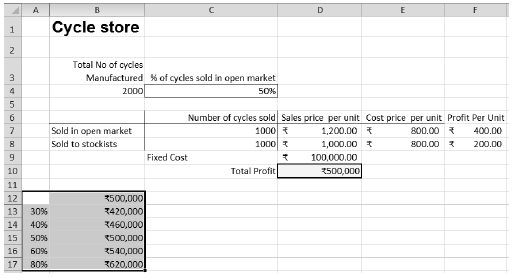
If you wish to analyze impact of different values for one or two variables on the outcome in an excel sheet you can safely make use Data Tables. If you want analyze the impact on profits earned if the proportion sold in open market assumes values of 30%, 40%, 50%, 60%, 80%, etc. you can use data table.
Here we cannot use goal seek. Goal seek allows us to determine the value of an input that will enable us achieving our targets. Whereas, in the present scenario we want to see how our profits will be turn out as a response to the values assumed for the input(s).A data table quickly tries out different values of inputs in the formulas and determines the output. You can create a one variable data table or a two variable data table.
Presently we have assumed changes in one variable only therefore we need to make one variable data table.
One Variable Data Table
To create a one variable data table, execute the following steps.
- Type the different percentages in column A.
- Select cell B12 and type =D10 (refer to the output cell).
- Select the range A12:B17.
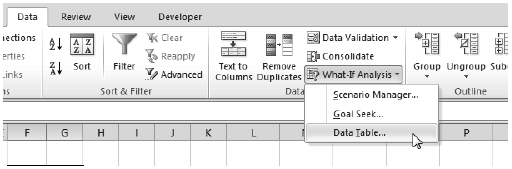
- On the Data tab, click What-If Analysis and select Data Table from the list.
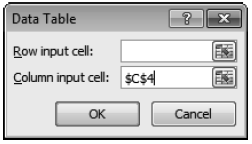
- Click in the ‘Column input cell’ box (since we have entered the different percentages in a column) and select cell C4.
You need to select cell C4 because the percentage of cycles sold in the open market is being referred in the formula from C4 (% sold in the open market). Considering the formula entered in the cell B12, excel now knows that it should replace cell C4 with different values of proportion sold to calculate the total profit. Since there is only one variable assuming different values leave the Row input cell blank. Had the inputs been arranged in rows we would have entered cell C4 in ‘Row input cell’ and left the ‘column input cell’ box blank.
- Click OK to get the results.
Two Variable Data Table
Suppose that you are expecting changes in units sold in open market the unit price and assume values of `1400, ` 1200, ` 1150, ` 1100 and ` 1050 respectively. To see the impact on profits of changes in proportion sold in open market and the changes in unit price both you can create a two variable data table.
Execute the following steps:
- Type the different unit Prices in row 12 starting from cell B12.
- Type the different percentages in column A starting from cell A13.
- Select cell A12 and type =D10 (refer to the cell containing formula to compute the total profit as we did earlier).
- Select the range A12:F17.
- On the Data tab, click What-If Analysis and select Data Table from the list.
- Click in the ‘Row input cell’ box and select cell D7(the unit prices in open market are in a row).
- Click in the ‘Column input cell’ box and select cell C4(the different proportions sold in open market are in a column).
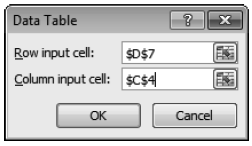
- Click OK to get the results.
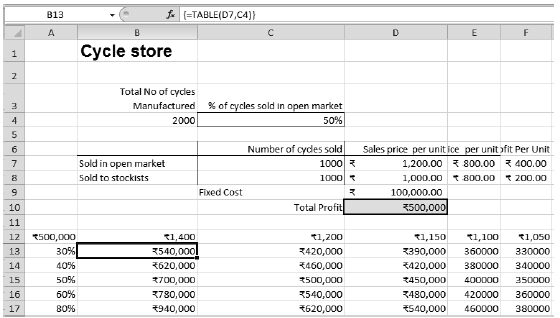
The table so generated is self-explanatory. If you want to know the profit if you sell 60% of units produced in open market at a price of ` 1100, simply locate the cell at intersection of the inputs as indicated in the above figure by the arrow. The profit here is ` 420000.
1.3 Scenario Manager
Data table that we discussed above can handle changes in one variable or two variables. But if you are thinking of scenario in which more than two variables change data table cannot handle the scenario. If you wish to analyze the impact of changes in multiple inputs on the output you can make use of Scenario Manager.
Let us assume the following scenarios:
| Scenario | Proportion Sold in open market |
Unit price in open market | Fixed cost |
| A | 30.00% | ` 1,400 | ` 100,000 |
| B | 50.00% | ` 1,200 | ` 120,000 |
| C | 70.00% | ` 1,150 | ` 125,000 |
| D | 100.00% | ` 1,150 | ` 135,000 |
In the above scenarios there are changes in three variables and therefore we need to make use of scenario manager to determine the profit in each scenario.
Creating Different Scenarios
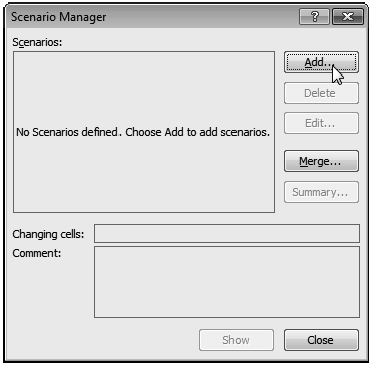
- On the Data tab, click What-If Analysis and select Scenario Manager from the list.
The Scenario Manager dialog box appears.
- Add a scenario by clicking on Add.
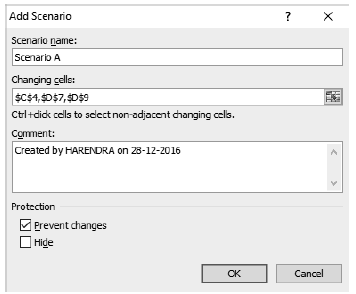
- Type the scenario name (Scenario A, Scenario B, etc.)
- Click in ‘Changing Cells’ box and select cell that vary. For example select C4 to incorporate changes in proportion sold in open market. Press Ctrl and select other variable cells like D7 for unit price in open market and cell D9 for fixed cost. Alternatively you can use “,” a separator to enter the different variables. Click OK.
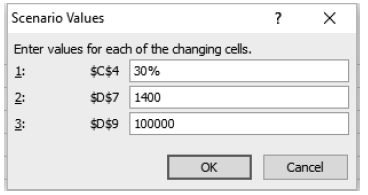
- Enter the corresponding value for different scenarios and click on OK again.
- Click on ‘Add’ to add other 3 other scenarios (Scenario B, Scenario C and Scenario D).repeat the process till different input values for different scenarios are entered.
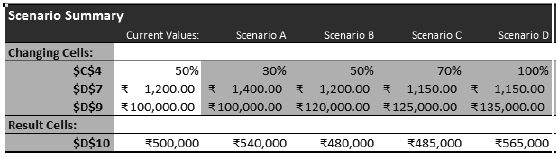
Finally, your Scenario Manager should be consistent with the following figure:
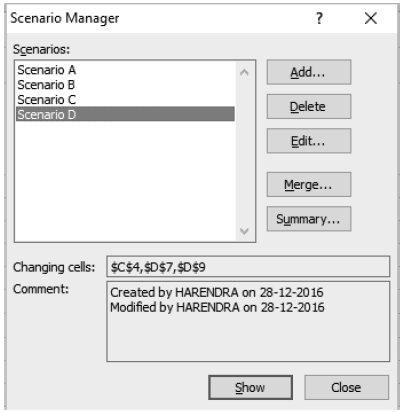
If you find out that that in any of the scenarios some error occurred, select the scenario to be modified and click on edit to correct the error.
- Click on summary.
- Under the ‘result cell box’ select cell D10 (output cell, that determines profit in the present case)
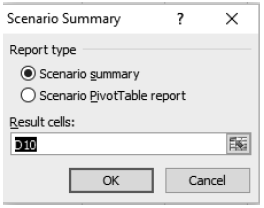
- Click OK to get the results
Disclaimer: The content/information published on the website is only for general information of the user and shall not be construed as legal advice. While the Taxmann has exercised reasonable efforts to ensure the veracity of information/content published, Taxmann shall be under no liability in any manner whatsoever for incorrect information, if any.
Taxmann Publications has a dedicated in-house Research & Editorial Team. This team consists of a team of Chartered Accountants, Company Secretaries, and Lawyers. This team works under the guidance and supervision of editor-in-chief Mr Rakesh Bhargava.
The Research and Editorial Team is responsible for developing reliable and accurate content for the readers. The team follows the six-sigma approach to achieve the benchmark of zero error in its publications and research platforms. The team ensures that the following publication guidelines are thoroughly followed while developing the content:
- The statutory material is obtained only from the authorized and reliable sources
- All the latest developments in the judicial and legislative fields are covered
- Prepare the analytical write-ups on current, controversial, and important issues to help the readers to understand the concept and its implications
- Every content published by Taxmann is complete, accurate and lucid
- All evidence-based statements are supported with proper reference to Section, Circular No., Notification No. or citations
- The golden rules of grammar, style and consistency are thoroughly followed
- Font and size that’s easy to read and remain consistent across all imprint and digital publications are applied

