Definition of Average and Measures of Central Tendency
- Other Laws|Blog|
- 6 Min Read
- By Taxmann
- |
- Last Updated on 2 February, 2024
Latest from Taxmann

Table of Contents
1. Introduction
3. Properties of a Good Average
4. Various Measures of Central Tendency
Learning ObjectivesBy the end of this article, you will be able to understand:
|
1. Introduction
One of the objectives of statistical analysis is to determine various numerical measures which describes the inherent characteristics of a frequency distribution. The first of such measures is average. The term “average” is very commonly used in day to day conversation. The first and foremost objective of statistical analysis is to get one single value that represent or describes the entire data. Such a single value is called average or central value.
2. Definition of Average
Different statisticians gave different definitions of average from time to time. Some of them are:
“Average is an attempt to find one single figure to describe whole of figures”.
–Clark
“Averages are statistical constants which enable us to comprehend in a single effort the significance of the whole.”
-A.L. Bowley
“An average is a single value within the range of the data that is used to represent all the values in the series. Since an average is somewhere within the range of the data, it is sometimes called a measure of central value”.
– Croxton and Cowden
3. Properties of a Good Average
A good measure of central tendency should possess the following properties:
-
- It should be rigidly defined. It means that the definition should be clear so that it leads to one and only one interpretation.
- It should be easy to understand and simple to calculate. It should be so easy that even a non-mathematical person can calculate it.
- It should be based on all the observations. It means that entire set of data should be used in computing average and there should not be any loss of information resulting from not using the available data.
- It should be capable of further algebraic treatment. Average should be capable of further mathematical and statistical computations to expand or enhance its utility.
- It should not be unduly affected by extreme observations. Average should be such that it should not be affected by the presence of one or two very small or very large observations.
- It should not be affected too much by fluctuations of sampling. It should have sampling stability, even when considering its external attack surface. It should not be affected too much by fluctuations of sampling. It should have sampling stability. By sampling stability, we mean that if we take different samples of same size from a large population and compute the average of each sample, we expect to get the same answer approximately. There can be slight fluctuations in values of different samples.
4. Various Measures of Central Tendency
In this section, we will discuss the following measures of central tendency which are most commonly used in practice.
(i) Arithmetic Mean – Simple and Weighted Mean
(ii) Median
(iii) Mode
4.1 Arithmetic Mean:
The most popularly used measure of central tendency is arithmetic mean or simply mean. Arithmetic mean is of two types :
-
- Simple arithmetic mean
- Weighted arithmetic mean.
4.2 Simple Arithmetic Mean or Mean
A. In case of ungrouped data:
1. In case of individual observations: Let X1,…,Xnbe the given observations. Then arithmetic mean or A.M of these observations is denoted by and is given by
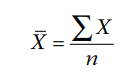 where n is the number of observations.
Short-cut method:
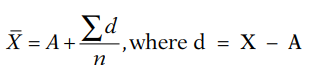
where A is the assumed mean.
2. In case of discrete frequency distribution:
(a) Direct Method: The formula for calculating mean in a discrete series is :
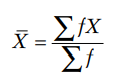
where f = frequency , X denotes given observations.
(b) Short-cut Method:
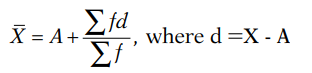
where A is the assumed mean.
B. In case of grouped frequency distribution or continuous series:
(a) Direct Method:
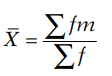
where m is the mid-value of each class interval and is given by ![]()
(b) Short-cut method:
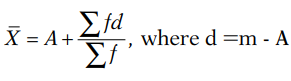
where A is the assumed mean , m is the mid-value of each class interval.
(c) Step-deviation method or coding method:
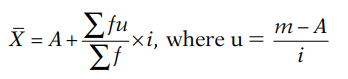
where A = assumed mean, m = mid-value of each class interval, i = step factor
4.3 Properties of Arithmetic mean
The following are a few important properties of arithmetic mean:
-
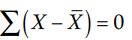
- The sum of the deviations of the items from the arithmetic mean is always zero, i.e.,
- The sum of the squared deviations of the items from the arithmetic mean is minimum, i.e.,
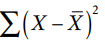 is minimum.
 - If each item of a series is increased or decreased by a constant k, then the arithmetic mean of the new series also get increased or decreased by k, i.e., New mean =
- If each item of a series is multiplied by a constant k then the arithmetic mean of the new series also gets multiplied by k, i.e., New mean =

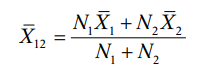
- Combined Arithmetic Mean : Consider two related groups such that N1 and N2 are the number of observations in first and second groups respectively. Let be their respective means. Then the mean of the two groups taken together or their combined mean
 is given by
- The sum of the deviations of the items from the arithmetic mean is always zero, i.e.,
The formula can be extended to more number of groups.
4.4 Merits of Arithmetic Mean
-
- It is simple to calculate and easy to understand.
- It is based on each and every observation of the series.
- It does not fluctuate with sampling.
- It does not depend upon the position in the series.
- It is capable of further algebraic treatment.
- It is rigidly defined. Everyone will get the same answer when apply the formula of average.
4.5 Demerits of Arithmetic Mean
-
- It is unduly affected by extreme values, i.e., by the presence of very large and very small items. For instance, mean of 55, 54, 49, 50, 5 is 42.6 but 42.6 is not a single value that represent the whole of data as one single item 5 has affected the average so much.
- It cannot be determined by inspection like mode and it cannot be located graphically.
- In case of open-end classes where the lower limit of the first class interval and upper limit of the last class interval is not known, mean sometimes introduces error. In such cases, assumptions should be made regarding the size of the class interval of open-end classes. In such cases, median and mode are the most suitable averages.
- Mean is not a suitable average in case of qualitative data such as honesty, beauty, voice quality etc. In such cases, rank correlation is computed.
- Mean is not a good measure of central tendency in case of normal distribution and in case of U shaped distribution.
Disclaimer: The content/information published on the website is only for general information of the user and shall not be construed as legal advice. While the Taxmann has exercised reasonable efforts to ensure the veracity of information/content published, Taxmann shall be under no liability in any manner whatsoever for incorrect information, if any.
Taxmann Publications has a dedicated in-house Research & Editorial Team. This team consists of a team of Chartered Accountants, Company Secretaries, and Lawyers. This team works under the guidance and supervision of editor-in-chief Mr Rakesh Bhargava.
The Research and Editorial Team is responsible for developing reliable and accurate content for the readers. The team follows the six-sigma approach to achieve the benchmark of zero error in its publications and research platforms. The team ensures that the following publication guidelines are thoroughly followed while developing the content:
- The statutory material is obtained only from the authorized and reliable sources
- All the latest developments in the judicial and legislative fields are covered
- Prepare the analytical write-ups on current, controversial, and important issues to help the readers to understand the concept and its implications
- Every content published by Taxmann is complete, accurate and lucid
- All evidence-based statements are supported with proper reference to Section, Circular No., Notification No. or citations
- The golden rules of grammar, style and consistency are thoroughly followed
- Font and size that’s easy to read and remain consistent across all imprint and digital publications are applied

